The OPC UA ETL Problem Nobody Talks About: Data Transformation
Table of contents
- The $327 million unit conversion error
- What OPC UA solved, and what it didn't
- The ETL reality: most tools focus on the wrong problem
- Why transformations matter on a real plant floor
- The three levels of OPC data transformation
- Why visual DAGs help
- OPC Data Wrangler: visual ETL for OPC UA
- Getting started
- Compared to traditional OPC ETL tools
The $327 million unit conversion error
In 1999, NASA's Mars Climate Orbiter burned up in the Martian atmosphere. A subcontractor's software used imperial units while NASA's system expected metric.1 The cost was $327.6 million.
You might think that is a NASA story, not a plant-floor story. It isn't. Your European pressure sensor outputs Bar. Your American SCADA expects PSI. Someone is paying a systems integrator to write a script that multiplies by 14.5038 and gets it wrong half the time.
That is the OPC UA ETL problem nobody talks about.
What OPC UA solved, and what it didn't
OPC UA was a real improvement over OPC DA. It eliminated COM/DCOM, added security, and works across platforms. Protocol-level integration got easier.
OPC UA does not solve transformation. Your PLC uses tag name Temperature_Tank1 in Celsius. Your SCADA wants Plant1.Temp.Tank01 in Fahrenheit. Your historian needs SITE_01.TMP.TNK_001 in Kelvin for some reason.
OPC UA moves the data. Transforming it, converting units, applying formulas, smoothing noise, that is still on you.
The ETL reality: most tools focus on the wrong problem
Search for "OPC UA ETL" and you will find tools that emphasize protocol bridging (MQTT, REST, Modbus), file format conversion (JSON, XML, CSV), and database connectivity (SQL, MongoDB).
Useful, but those are routing problems. The harder problem is transforming the data once it is moving.
Based on OPC Foundation research on multi-vendor integration234, the actual pain points include data fragmentation across multiple OPC servers with different formats and units, heterogeneous platforms mixing old and new devices, naming inconsistencies between vendors, unit diversity (European metric, US imperial, Japanese variants), and complex information models that require domain knowledge to map correctly.
Most OPC UA ETL tools treat these as afterthoughts.
Why transformations matter on a real plant floor
Unit conversion errors are not just a NASA story. NIST tracks metrication errors1. A US company lost its profit margin selling wild rice because of pound versus kilogram confusion. Tokyo Disneyland's Space Mountain derailed in 2003 because of a 45 mm versus 44.14 mm axle mix-up. The "Gimli Glider" Air Canada Flight 143 nearly killed 69 people because of a fuel calculation in pounds where the spec was kilograms.
In manufacturing, unit conversion mistakes show up as production delays, inventory inaccuracies, batch failures, audit failures, and recalls. The problem is not moving the data. It is transforming it correctly.
The three levels of OPC data transformation
From the OPC integrations I have worked through, transformations fall into three categories.
Level 1: Unit conversion
Sensor A speaks Bar. Sensor B speaks PSI. SCADA expects kPa. The math is trivial. The risk is high because manual conversions are error-prone and the conversion factors get hard-coded into scripts that nobody reviews.
Common conversions: temperature (Celsius, Fahrenheit, Kelvin, Rankine for legacy systems), pressure (Bar, PSI, Pascal, Atmosphere, Torr), flow rate (L/min, GPM, m³/h), length (mm, inches, feet), mass (kg, lbs).
Level 2: Formula evaluation
Flow meter needs temperature compensation: corrected = raw * (273.15 + temp) / 293.15. The math takes domain knowledge but stays simple. The risk is medium; the formulas need validation against the physical setup.
Common formulas: temperature compensation for gas flow, scaling (display_value = (raw_value - offset) * scale), ratio calculations (efficiency = actual / theoretical * 100), multi-register assembly (value = (high_byte << 8) | low_byte).
Level 3: Custom logic in Python
Smoothing noisy sensor data, parsing vendor-specific formats, complex state machines. High complexity because it requires actual programming. Low risk if tested, because explicit code is less error-prone than hidden config.
Common use cases: moving average smoothing across the last N values, statistical calculations like standard deviation and variance, range checks and outlier detection, conditional logic for multi-step decisions.
Why visual DAGs help
Traditional OPC ETL works like this. Edit a configuration file (XML, JSON, or proprietary format). Define sources, transformations, destinations. Deploy. When something breaks, dig through logs to find which transformation failed.
The problem is that you cannot see the data flow. You are reading config syntax, not understanding the pipeline.
A Directed Acyclic Graph (DAG) shows the data flow visually. You see the entire pipeline at a glance. You identify where transformation fails. Dependencies are explicit, parallel processing is visible, and the DAG is the documentation.
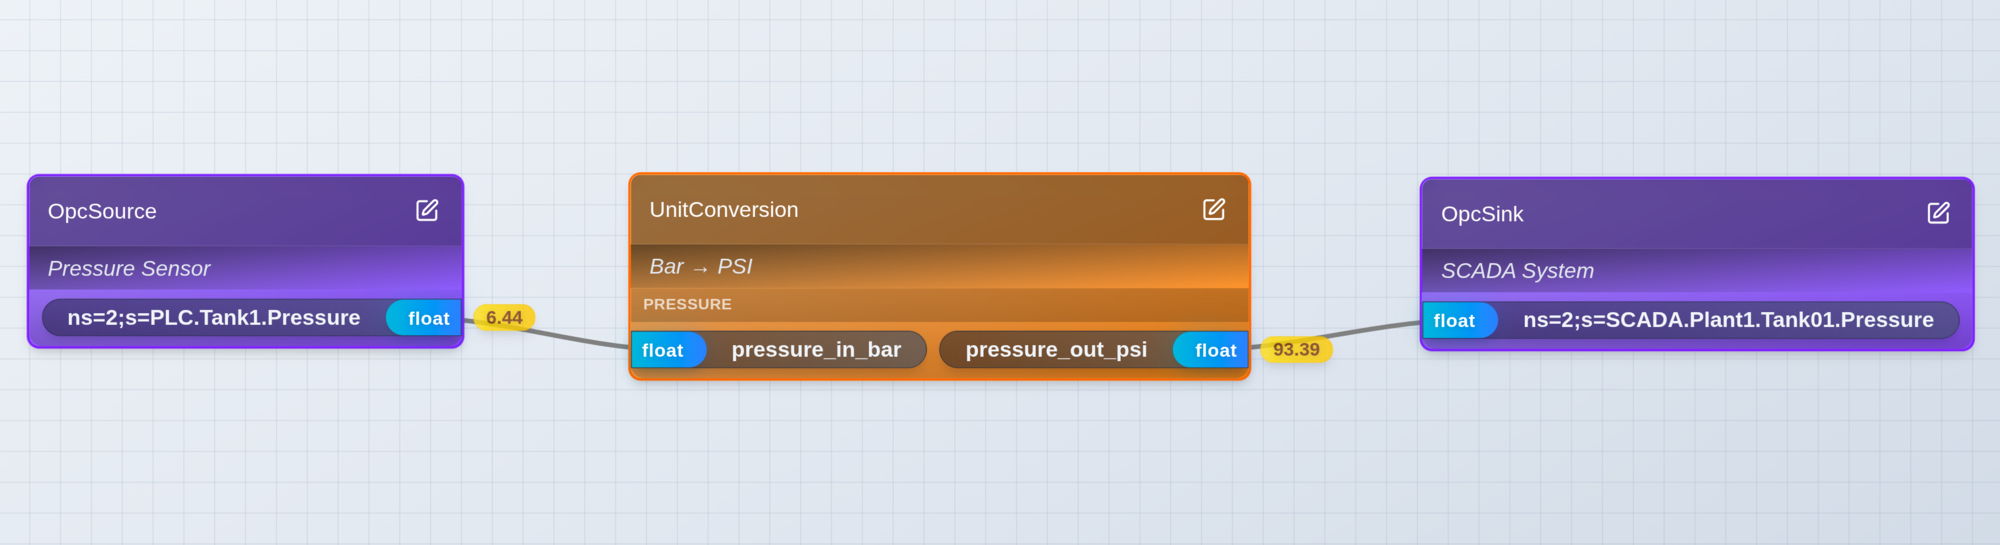 Example: a simple OPC ETL pipeline with unit conversion visible in the DAG
This is how modern data engineering works. Airflow, Dagster, Prefect. OPC UA ETL is overdue for the same.
OPC Data Wrangler: visual ETL for OPC UA
I built OPC Data Wrangler because industrial automation needed a purpose-built ETL tool, and nothing like it existed.
Visual DAG builder
Drag and drop nodes onto a canvas. OPC Source connects to any OPC UA server. OPC Sink writes to any OPC UA server. Unit Conversion covers 11 industrial unit categories with over 50 units. Formula Eval evaluates mathematical expressions with named variables. Python Transform handles complex logic. CSV Source and Sink import and export data.
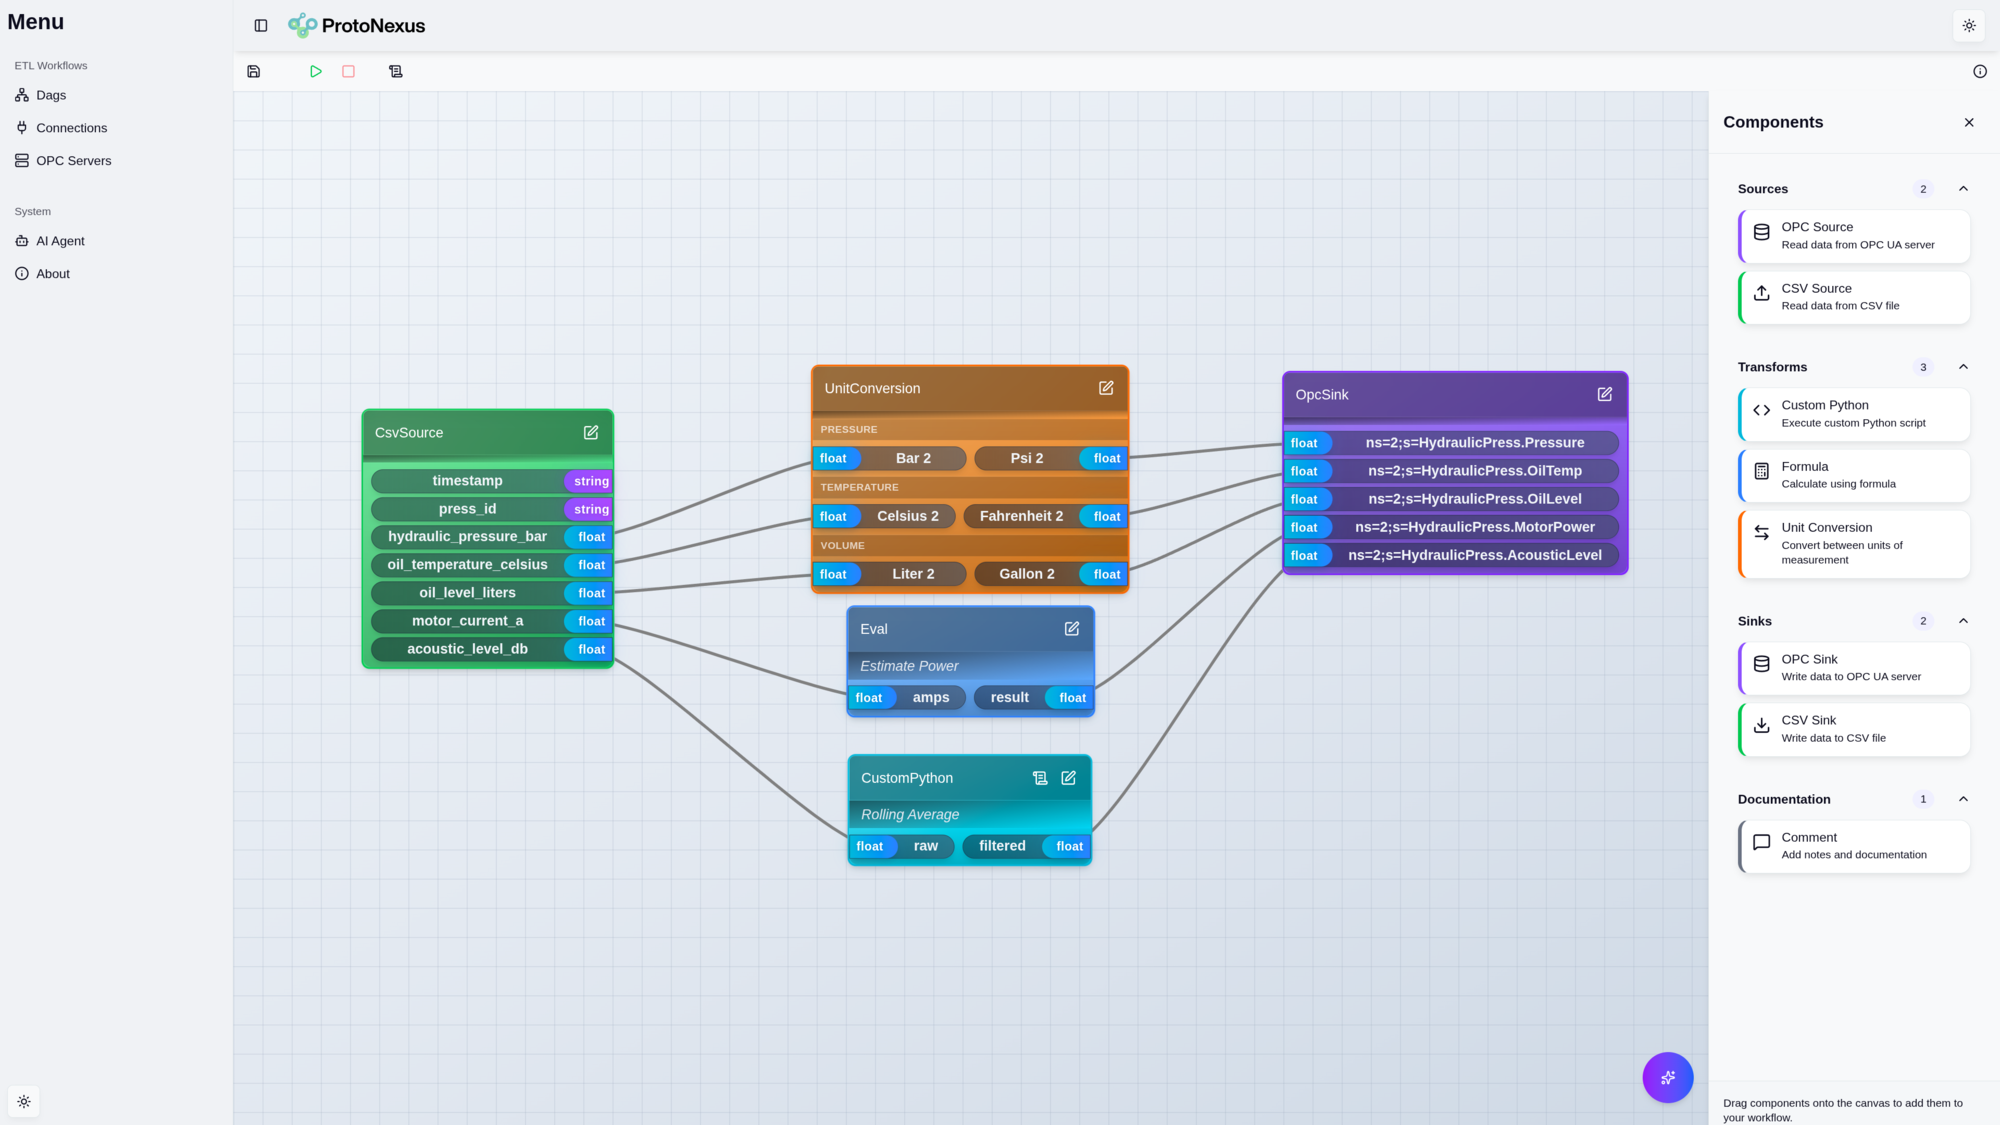 The OPC Data Wrangler visual DAG builder with node palette and canvas
Built-in unit conversions
OPC Data Wrangler ships with 11 industrial unit categories and validated conversion factors. Temperature (Celsius, Fahrenheit, Kelvin, Rankine, Delisle). Pressure (Pascal, Bar, PSI, Atmosphere, Torr). Mass (kg, lbs, tons). Volume (liters, gallons, m³). Flow rate (L/min, GPM, m³/h). Plus length, velocity, acceleration, energy, and power.
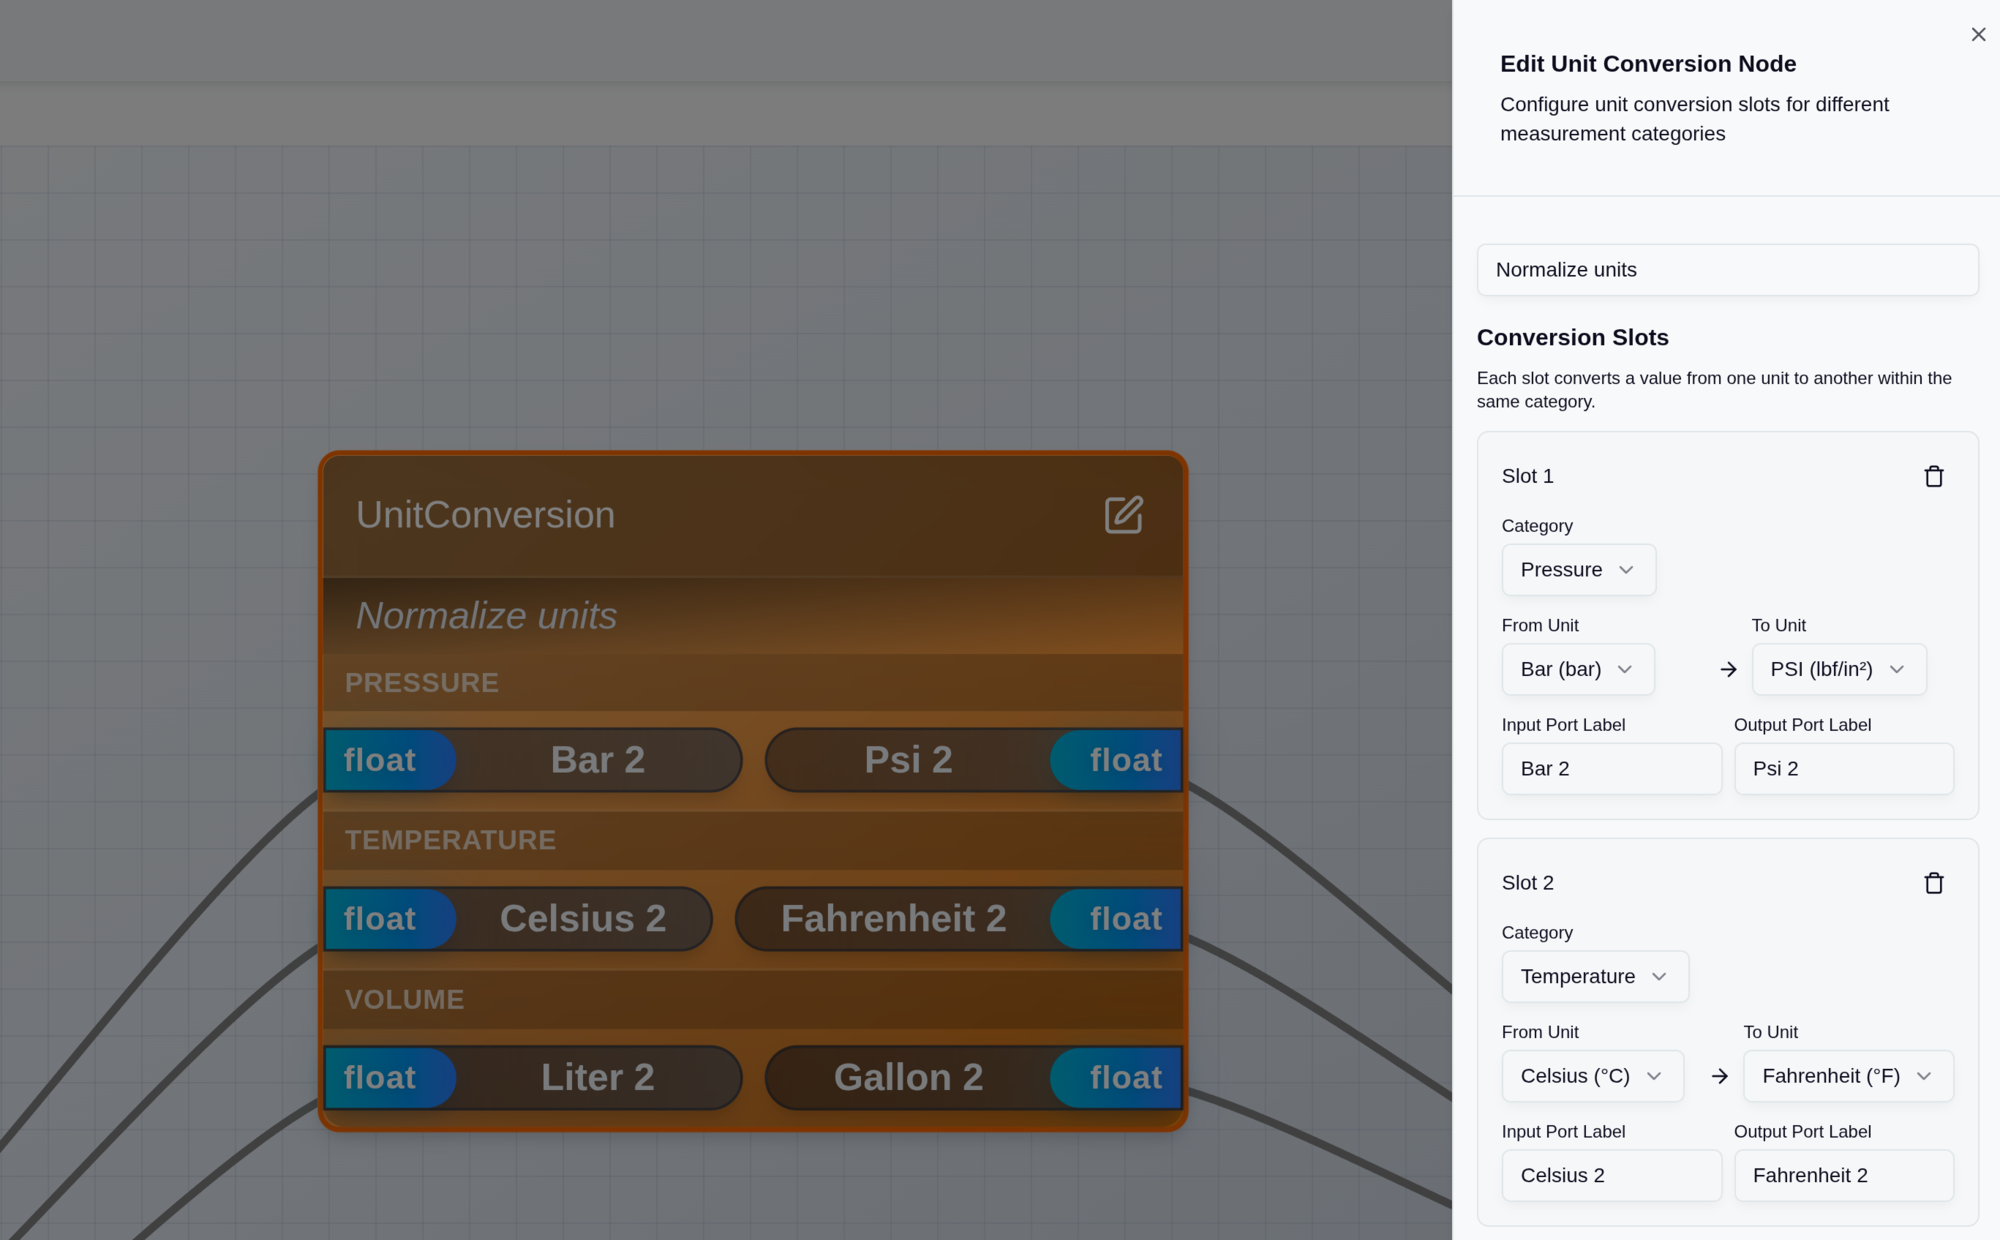 Configuring a unit conversion: select from-unit and to-unit from dropdown menus
No more hunting for conversion factors. No more wondering if 1 Bar is 14.5038 PSI or 14.5 PSI. Select the units and go.
Real example: multi-vendor pressure sensors
Three pressure sensors from different manufacturers output different units. Sensor A from Endress+Hauser outputs Bar. Sensor B from Honeywell outputs PSI. Sensor C from Yokogawa outputs kPa. Your SCADA expects PSI everywhere.
Traditional approach: write custom scripts with conversion formulas, deploy to middleware, debug when SCADA shows wrong values.
With OPC Data Wrangler: one OPC Source node with three slots, one Unit Conversion node with three slots (Bar to PSI, PSI pass-through, kPa to PSI), connect to OPC Sink. Two hours of integrator work compresses to ten minutes of node configuration. Manual math becomes built-in validated conversions.
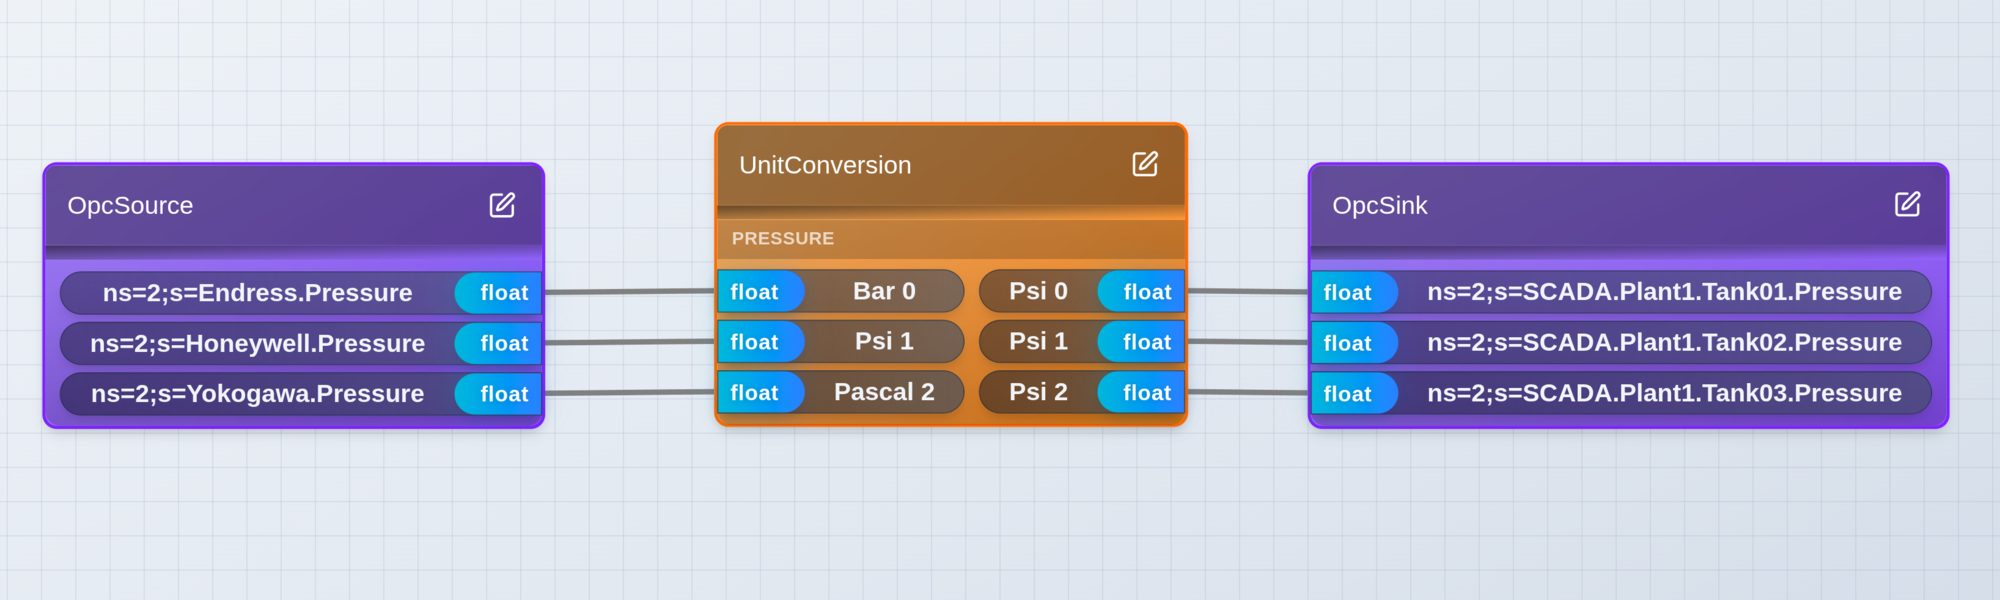 Three pressure sensors with different units converging to one SCADA system
Formula Eval for quick math
Temperature compensation, scaling, simple calculations. Named variables make formulas readable. No Python overhead.
Real example: temperature-compensated flow meter
Natural gas flow meter gives a raw reading, but gas density changes with temperature. Apply ideal gas law compensation:
compensated_flow = measured_flow * (273.15 + temperature) / 293.15
In the DAG: OPC Source reads flow and temperature. Formula Eval node takes inputs flow and temperature, expression flow * (273.15 + temperature) / 293.15. OPC Sink writes the compensated value.
The formula is visible in the DAG node. No hidden logic.
Python Transform for complex logic
When you need real programming: full Python standard library, multiple inputs and outputs, error handling with tracebacks.
Real example: smoothing noisy sensor data
Vibration sensor on a motor produces noisy readings. You want a 10-sample moving average for real-time smoothing.
recent_values = []

def transform(sensor_reading):
    recent_values.append(sensor_reading)
    if len(recent_values) > 10:
        recent_values.pop(0)
    return sum(recent_values) / len(recent_values)
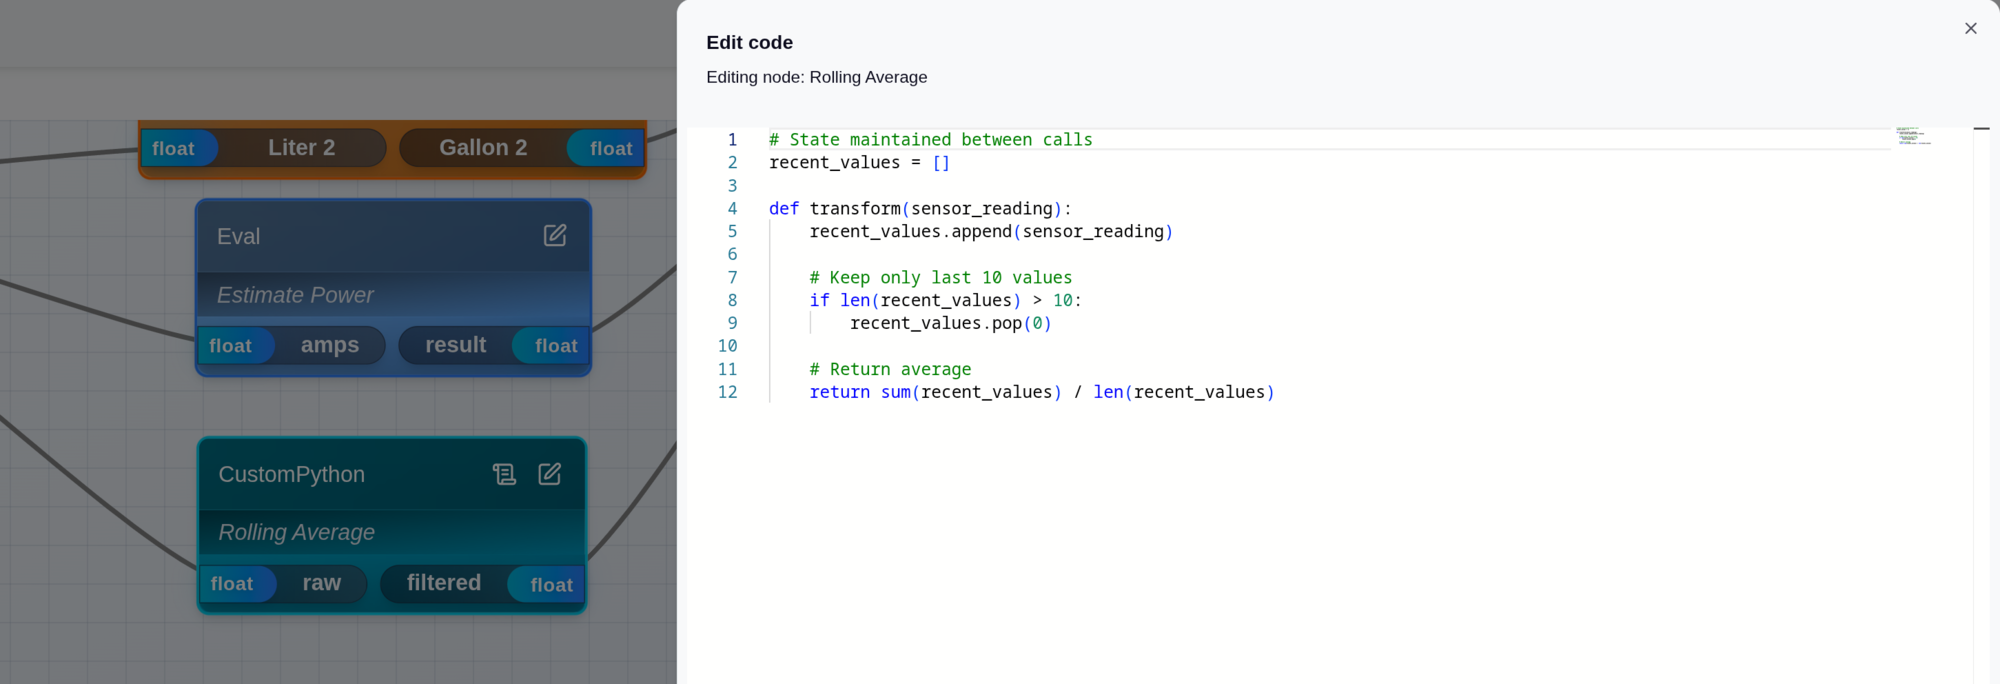 Write Python directly in the transform node with syntax highlighting
State persists between calls. No external database needed.
AI Copilot to build pipelines
Describe the pipeline in plain English:
Read temperature from PLC_01 in Celsius, convert to Fahrenheit, and write to SCADA_Server tag Plant1.Temp.Tank01
The OPC Data Wrangler Copilot builds the DAG. You adjust as needed and deploy.
Getting started
Installation options
Docker (Linux, macOS, Windows) (coming soon)
docker run -p 8080:8080 opcdatawrangler/opcdatawrangler:latest
Good for quick testing or containerized deployments.
Windows Service Installer. Download from opcdatawrangler.com and run the setup wizard. Installs as a Windows service. Access through the desktop app or a web browser.
Build the first pipeline
Connect OPC Source: enter the server URL, browse nodes, select tags to read. Add a transformation: Unit Conversion (select from-unit and to-unit), Formula Eval (write the expression with named variables), or Python Transform (write the function). Connect OPC Sink: destination URL, map source tags to destination tags, set write intervals. Deploy and watch live data flow in the DAG.
Compared to traditional OPC ETL tools
| Feature | Traditional tools | OPC Data Wrangler |
|---|---|---|
| Visual data flow | Config files | Interactive DAG |
| Unit conversions | Manual scripting | 11 categories built-in |
| Custom logic | Proprietary languages | Python with full stdlib |
| Formula evaluation | Limited | Named variables, readable |
| AI assistance | None | Natural language pipeline builder |
| Deployment | Windows-only desktop | Docker (Linux) or Windows service |
Why this matters
OPC UA solved the protocol problem. Most of your time is not on protocols, it is on transformations. Converting units between vendors, applying compensation formulas, cleaning up noisy data, statistical processing.
Traditional OPC UA ETL tools make you write scripts for these. OPC Data Wrangler gives you visual tools for the common cases (about 90% of transformations) and Python for the rest.
When you do need code, you get Python with the full standard library, not a proprietary scripting language.
Get started
Register for early access: https://opcdatawrangler.com/register
Documentation: https://opcdatawrangler.com
Questions? Reach out on LinkedIn or GitHub.
References
Footnotes
-
NIST, Metrication Errors and Mishaps, https://www.nist.gov/pml/owm/metrication-errors-and-mishaps ↩ ↩2
-
OPC Foundation, Multi-Vendor Alarm Integration, https://opcconnect.opcfoundation.org/2022/09/multi-vendor-alarm-integration-with-opc-ua/ ↩
-
OPC Foundation, Gathering Data from Various Devices, https://opcconnect.opcfoundation.org/2022/03/gathering-data-from-various-devices-and-vendors-via-opc-ua/ ↩
-
OPC Foundation, Unified Data Integration, https://opcconnect.opcfoundation.org/2024/03/unified-data-integration-and-archiving-across-geographically-dispersed-sites/ ↩
Ready to Build Your OPC UA ETL Pipeline?
Join manufacturers using OPC Data Wrangler to modernize their industrial data infrastructure. Register today for early access.
About the Author
Chris Laponsie founded Thingamatronics to build modern industrial data engineering tools. OPC Data Wrangler is the broker and ETL layer for OPC UA workloads, with built-in unit conversion, formula evaluation, and Python transforms.
More from the Blog
Introducing OPC Telescope: A Modern OPC Client for Remote Troubleshooting
A portable OPC client with themes, dashboard, and monitoring features designed for troubleshooting signals in remote industrial environments.
Read Article →Why Industrial Engineers Are Learning Python (And Why Jython Isn't Enough)
Real Python for industrial transforms. Plus: how AI makes Python 10x more productive than DSLs.
Read Article →I Asked AI to Build My OPC Pipeline (And It Worked)
From natural language description to production DAG in 30 seconds
Coming Soon